AI Solar Panel Defect Detection Deployment
Documentation site: https://billzi2016.github.io/AI-Solar-Panel-Defect-Detection-Deployment/
This project focuses on defect detection for solar cells and photovoltaic panels. It is not meant to be a single training script. The repository is organized around the full workflow: dataset preparation, defect recognition, anomaly detection, inference deployment, and documentation that explains how each part is expected to work.
The project currently includes dataset statistics, VOC-to-YOLO conversion, YOLO detection experiments, ELPV image-level baselines, deployment export helpers, and a bilingual MkDocs documentation site.
Real Data Gallery
The README figures below are generated from real local dataset files. The scripts read ELPV labels from datasets/raw/elpv-dataset, read PV-Multi-Defect and PVEL-AD Pascal VOC annotations from datasets/raw/, redraw the real boxes, and save JPG files under assets/diagrams/.
Overview
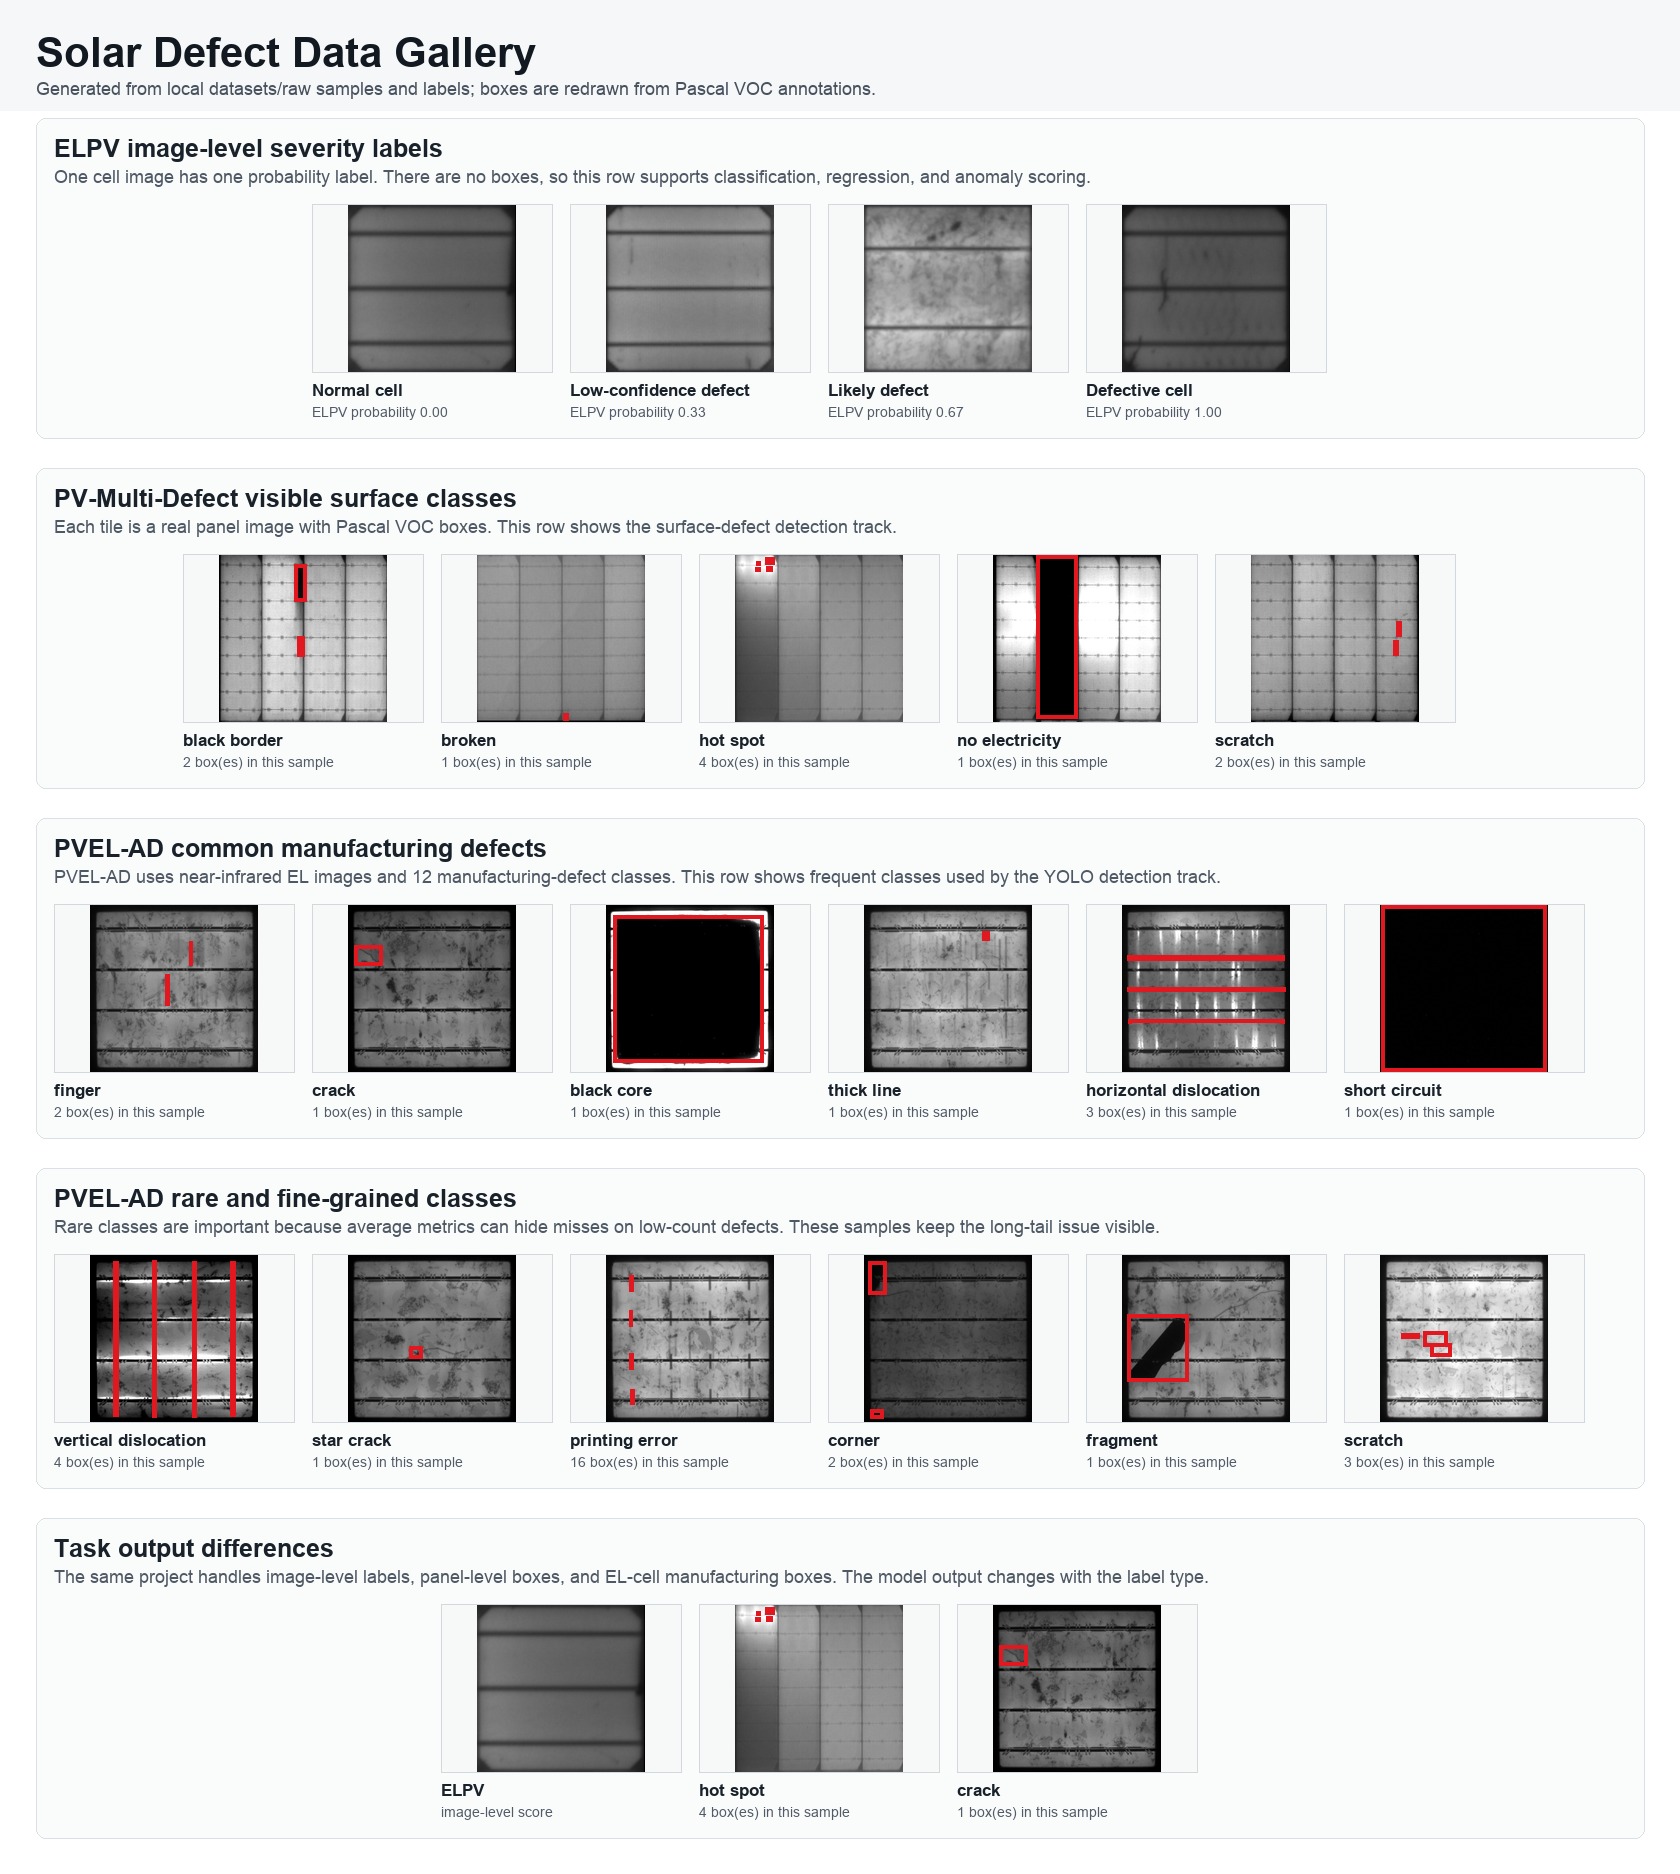
readme_dataset_gallery.jpg is the compact overview. It shows the main task dimensions in one figure: image-level ELPV labels, PV-Multi-Defect surface boxes, PVEL-AD common classes, PVEL-AD rare classes, and the difference between score outputs and box outputs.
Generate it with:
python3 assets/diagrams/build_readme_overview_gallery.py
ELPV Probability Dimension
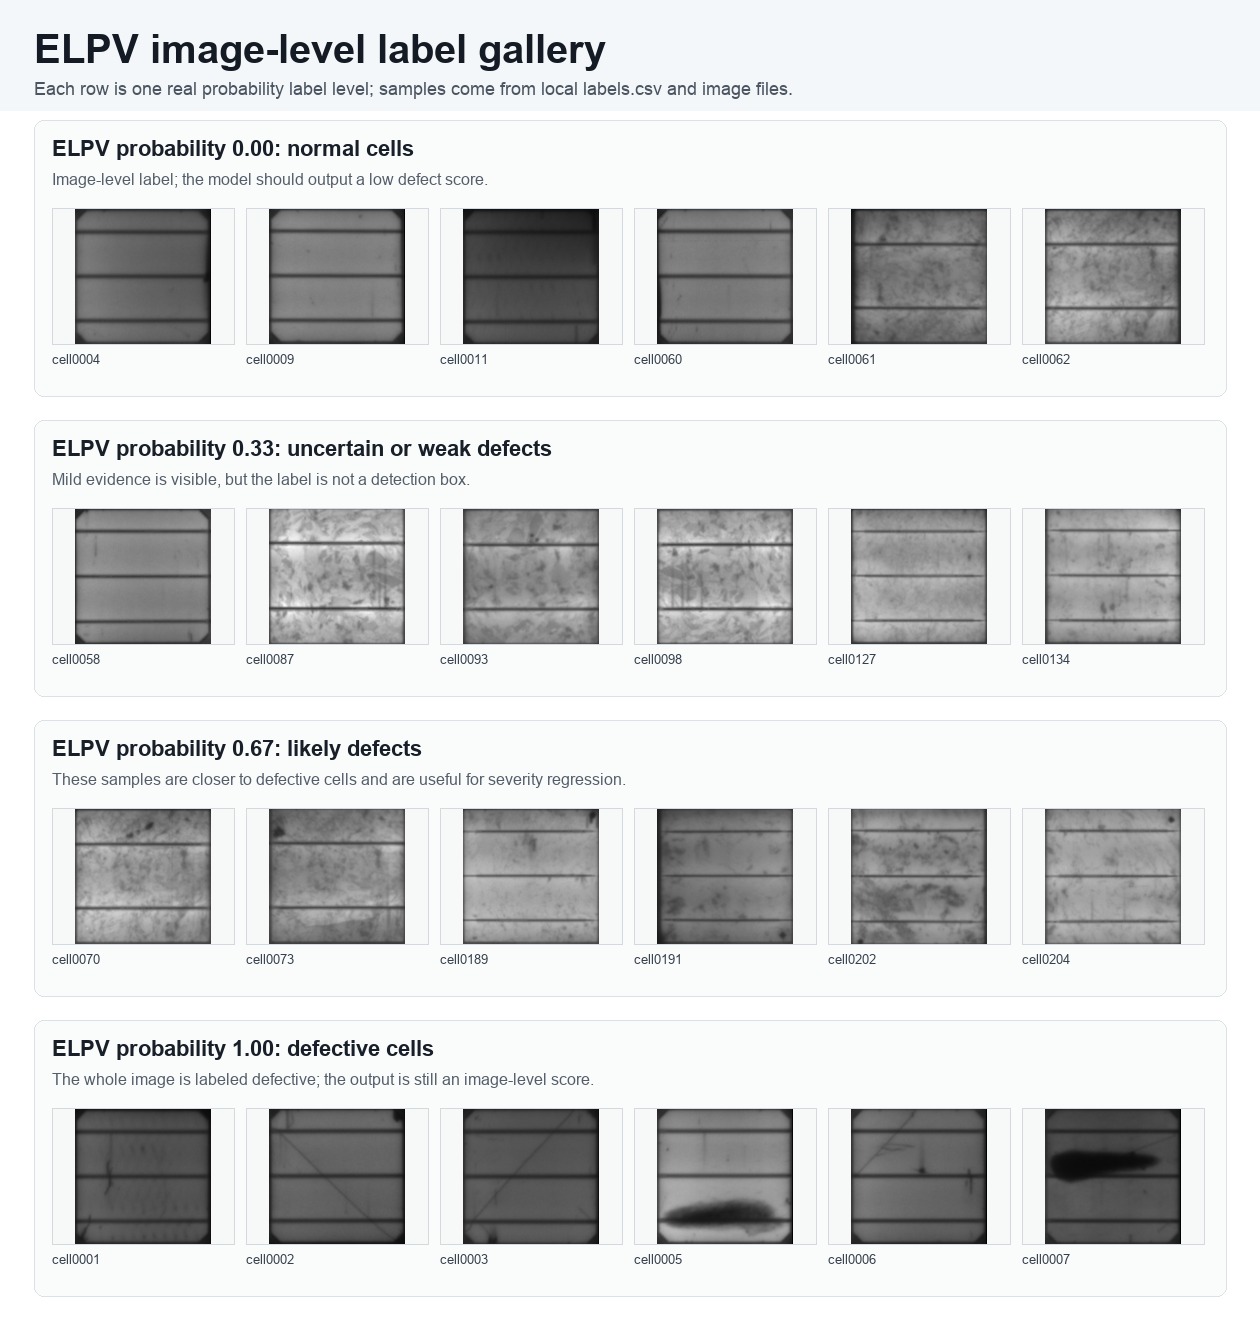
This figure groups ELPV by its real image-level probability labels. Each row is one probability value, and each row contains multiple real samples. ELPV has no bounding boxes, so this dimension belongs to classification, regression, or anomaly scoring rather than object detection.
PV-Multi-Defect Class Dimension
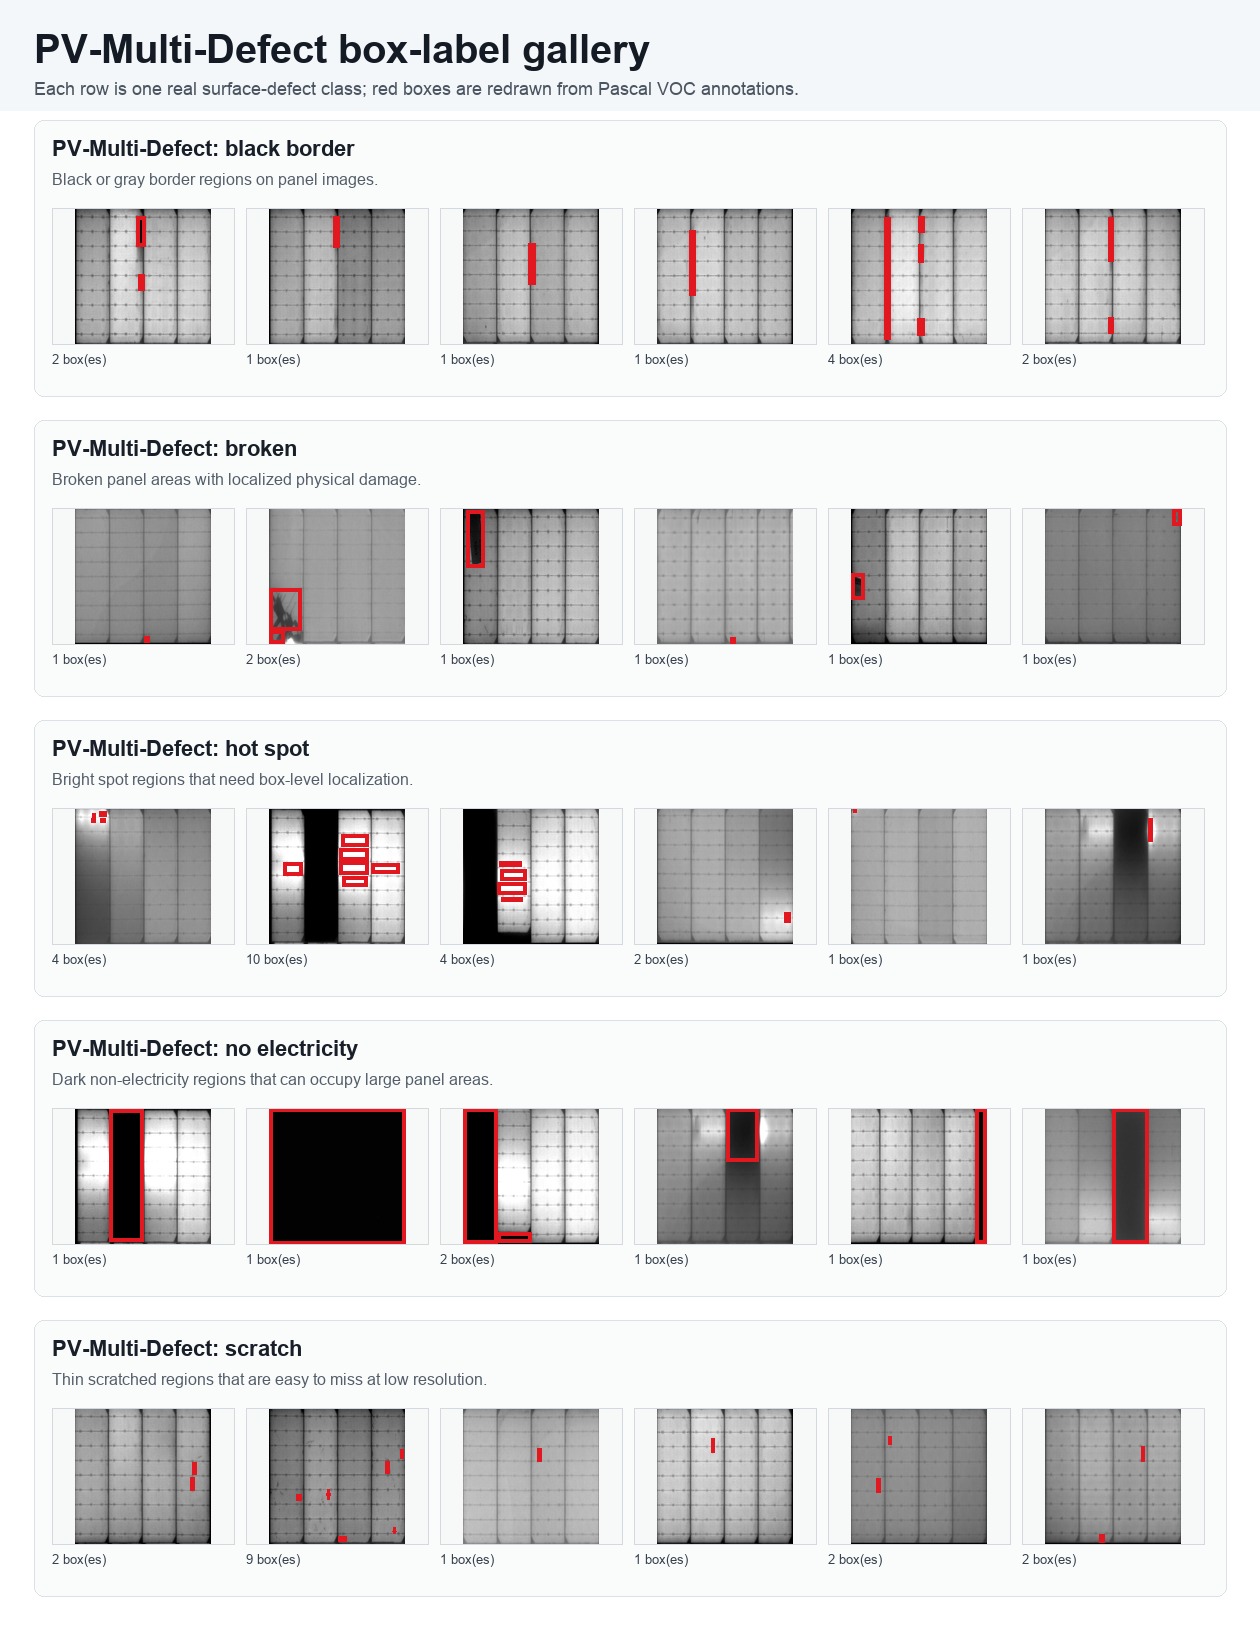
This figure groups PV-Multi-Defect by visible surface-defect class. Each row is one class, and red boxes are redrawn from the original Pascal VOC annotations. The row-level layout makes it easier to compare how different surface defects appear across multiple real samples.
PVEL-AD Class Dimension
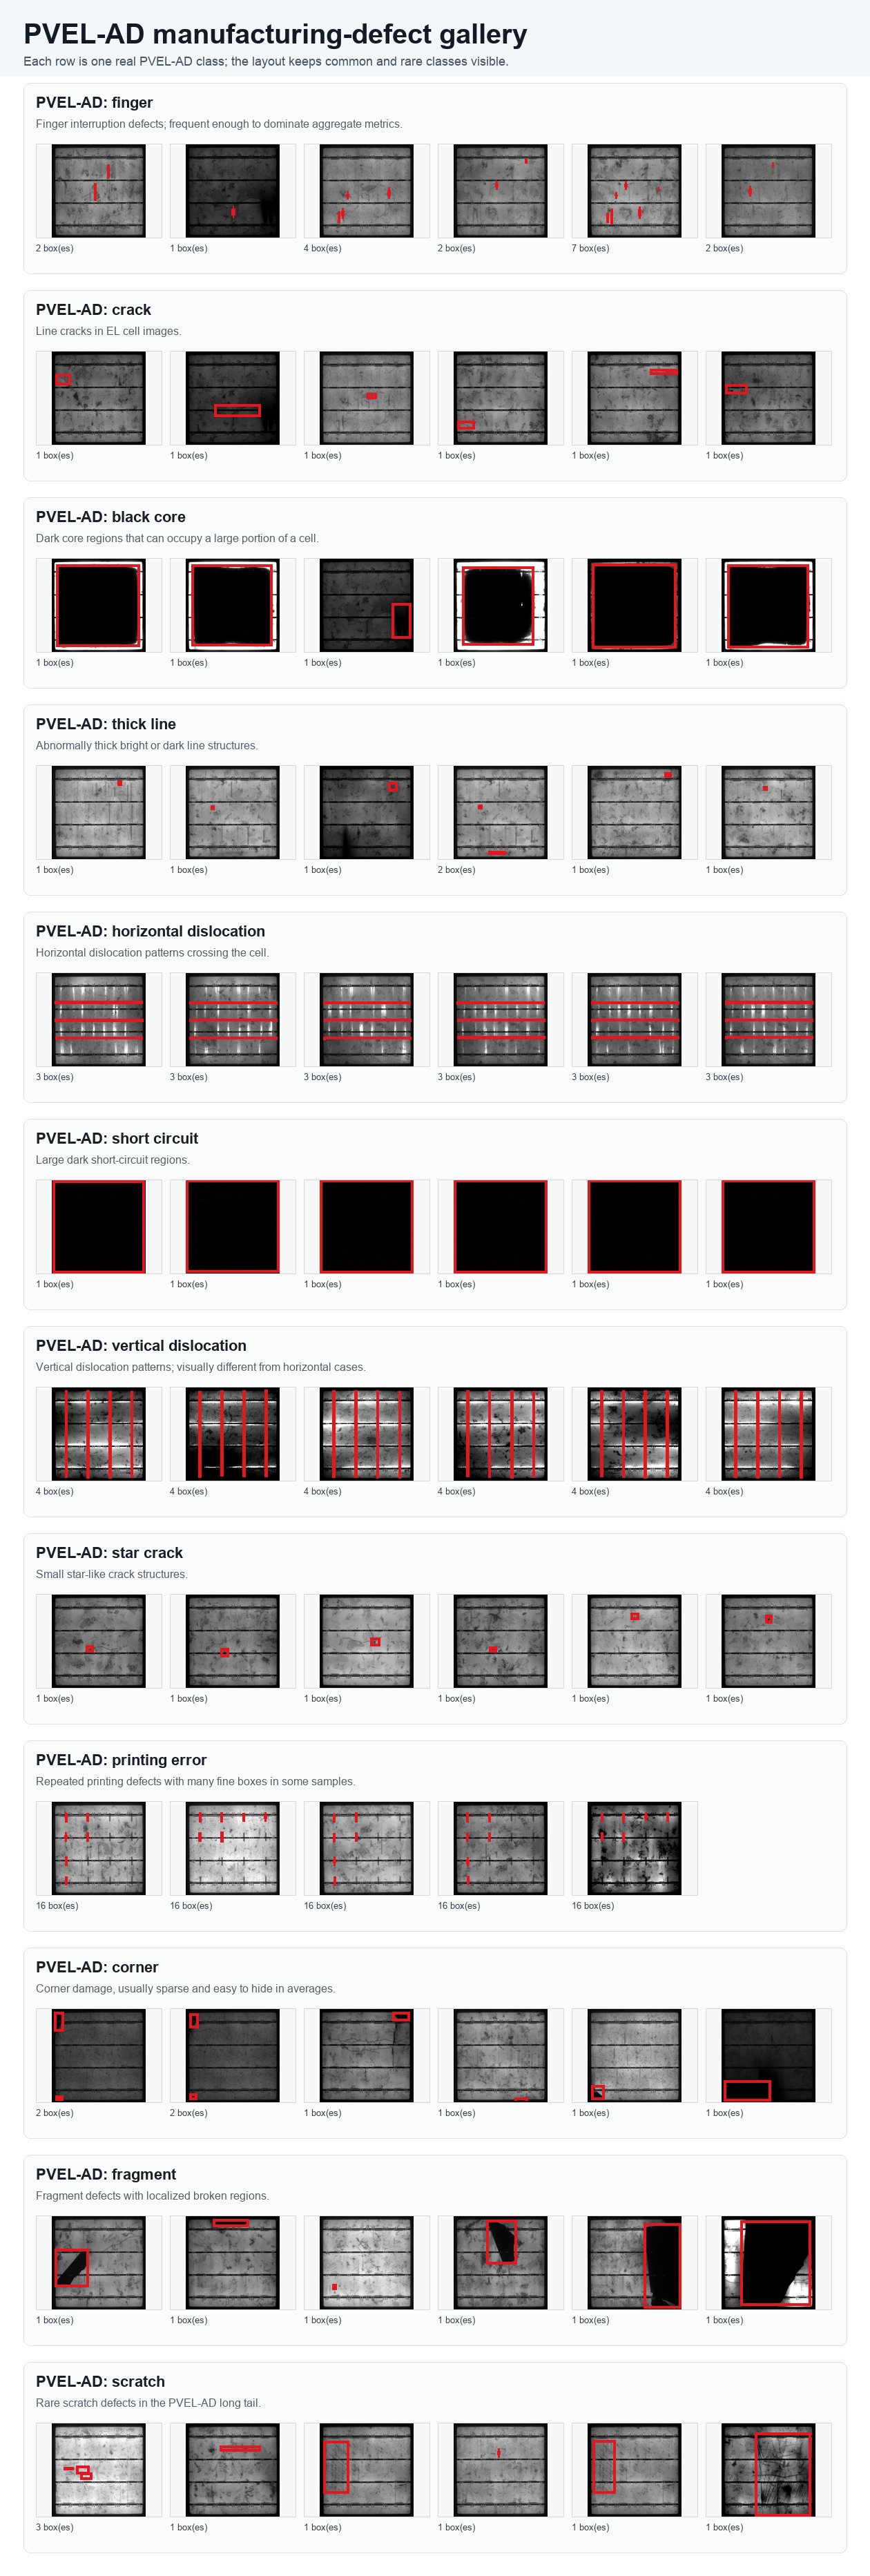
This figure groups PVEL-AD by manufacturing-defect class. Each row is one of the 12 PVEL-AD classes. Frequent and rare classes are both visible, which matters because aggregate detection metrics can hide weak recall on low-count classes.
Generate the three dimension galleries with:
python3 assets/diagrams/build_readme_dimension_galleries.py
What the project solves
Solar manufacturing and field inspection use several image sources, including EL images, PL images, infrared thermal images, and RGB images. Each source exposes different defects. EL images are useful for cracks, finger interruptions, and dark regions inside a cell. Infrared images are useful for hot spots. RGB images are useful for visible damage, occlusion, dust, and surface contamination.
This project starts with reproducible public EL defect datasets. The main tasks are:
- Locate defects: input a cell image and output bounding boxes, defect classes, and confidence scores.
- Estimate severity: input a cell image and output a normal, suspicious, or defective grade.
- Detect unknown anomalies: train on normal samples and flag regions that do not match normal cell texture.
- Optimize inference: export trained models to ONNX or TensorRT and compare accuracy, throughput, and latency.
Datasets
The project is organized around three public datasets.
| Dataset | Image type | Main use | Output |
|---|---|---|---|
| PVEL-AD | EL images | Multi-class object detection | Boxes, classes, confidence scores |
| ELPV | EL images | Classification, regression, anomaly detection | Defect probability or anomaly score |
| PV-Multi-Defect | PV defect images | Surface defect detection | Boxes, classes, confidence scores |
Datasets are not committed to git. Raw files should stay under datasets/raw/, and processed training files should stay under datasets/processed/. Both locations are ignored by .gitignore.
Method
The project keeps three algorithm tracks.
The detection track uses YOLO-style models. The input is an image, and the output is one or more defect boxes. This answers where a defect is and which defect class it belongs to.
The classification track uses models such as ResNet, EfficientNet, or MobileNet. The input is a cell image, and the output is a defect grade or defect probability. This works well for quick screening and for datasets such as ELPV, where labels are attached to whole images.
The anomaly detection track uses PatchCore or a similar method. During training, the model only sees normal samples and learns the local feature distribution of normal cells. During inference, regions that differ from normal samples receive higher anomaly scores. This is useful for new defect types and rare defects with very few examples.
Project structure
The documentation site lives in docs-site/. Chinese pages live under docs-site/docs/zh/, and English pages live under docs-site/docs/en/. Chinese files use the .zh.md suffix. English files do not use a language suffix.
The root README files are the source for the project overview. The README pages inside the documentation site are symlinks to the root README files, so the same overview is not maintained twice.
How to tell whether the project is healthy
The documentation site is healthy when mkdocs build -f docs-site/mkdocs.yml --strict finishes successfully. Strict mode checks navigation, page references, and broken internal links.
A normal run should produce:
- Dataset reports that list image counts, class distribution, and invalid labels.
- Training scripts that read data paths and model settings from configuration files.
- Evaluation scripts that report mAP, recall, F1, AUC, or latency metrics.
- Deployment scripts that export ONNX models and compare PyTorch outputs with deployment backend outputs.
Documentation
The full documentation is published through GitHub Pages:
https://billzi2016.github.io/AI-Solar-Panel-Defect-Detection-Deployment/
Dataset Statistics
The dataset audit lives in data_tools/stats/. It explains what ELPV, PV-Multi-Defect, and PVEL-AD contain, which task each dataset supports, how labels are represented, and how to judge whether the local download is complete enough for training.
Run the report generator from the project root:
python3 data_tools/stats/build_dataset_report.py
Experiments
Detection experiments live in experiments/detection/ and use Ultralytics YOLO instead of a custom detector implementation. Convert local VOC annotations first:
python3 data_tools/converters/build_yolo_detection_dataset.py --dataset pvel_ad
Then run the formal large-model training entry points from the project root. The default scripts use l configs. YOLO11 is the default experiment, and YOLOv8 is kept as a baseline so results can be compared across model generations.
./experiments/detection/yolo_train/train_yolo11_pvel_ad.sh
YOLOv8 baseline:
./experiments/detection/yolo_train/train_yolov8_pvel_ad.sh
On Apple Silicon, use MPS through Ultralytics and PyTorch:
DEVICE=mps ./experiments/detection/yolo_train/train_yolo11_pvel_ad.sh
PV-Multi-Defect uses matching formal scripts:
./experiments/detection/yolo_train/train_yolo11_pv_multi_defect.sh
For local resource-conscious validation, run ./experiments/detection/run_all_yolo_n.sh.
ELPV image-level experiments live in experiments/elpv/ and use torchvision ResNet-18 and Swin-T baselines:
python3 experiments/elpv/run_torchvision.py train --config configs/elpv/resnet18_binary.yaml
Deployment
Deployment helpers live in deployment/. YOLO checkpoints are exported through the Ultralytics export API:
python3 deployment/export_yolo.py \
  --model outputs/detection/pvel_ad_yolo11l/weights/best.pt \
  --format onnx \
  --imgsz 640
ELPV torchvision checkpoints are exported to ONNX with the matching config:
python3 deployment/export_elpv.py \
  --config configs/elpv/resnet18_binary.yaml \
  --checkpoint outputs/elpv/elpv_resnet18_binary/best.pt