Dataset Statistics Report
This report is generated from local dataset files with data_tools/stats/build_dataset_report.py. It gives the project one shared source of truth for image counts, annotation counts, class balance, and representative examples.
What This Report Checks
The script verifies four things before training code depends on the datasets:
| Check | Input | Output | Normal result |
|---|---|---|---|
| File discovery | Local datasets/raw/ folders |
Image and annotation counts | Counts match the expected public dataset scale. |
| Label parsing | ELPV CSV and VOC XML files | Class, probability, and box tables | Class names are readable and no parser errors occur. |
| Long-tail shape | Per-class object counts | Bar charts | Rare classes remain visible instead of being hidden by averages. |
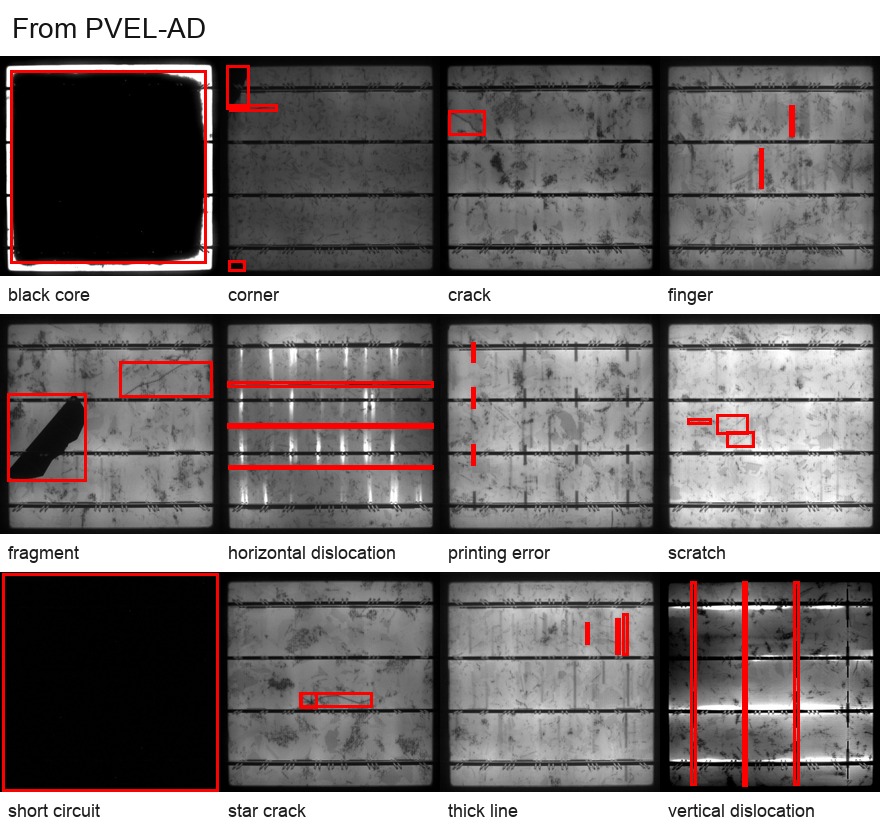
| Visual sanity | Real image files | Small example grids | Images open correctly and labels match the visible defect type. |
Dataset Overview
| Dataset | Local input | Label format | Images counted | Label units counted |
|---|---|---|---|---|
| ELPV Dataset | datasets/raw/elpv-dataset |
CSV defect probability | 2624 | 2624 probability labels |
| PV-Multi-Defect | datasets/raw/pv_multi_defect |
Pascal VOC XML boxes | 1106 | 3981 boxes |
| PVEL-AD | datasets/raw/pvel_ad/extracted |
Pascal VOC XML boxes | 36543 | 41958 boxes on 23650 annotated images |
From ELPV Dataset
ELPV is a cell-level electroluminescence image dataset. Each image has one defect-probability label instead of object boxes. The label answers a classification question: how likely is this cell to contain a visible defect?
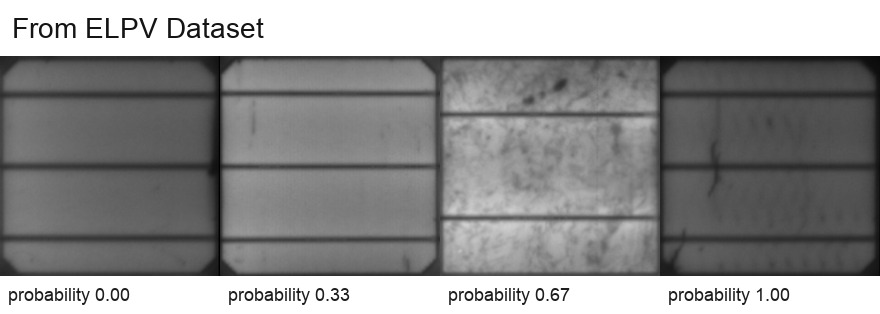
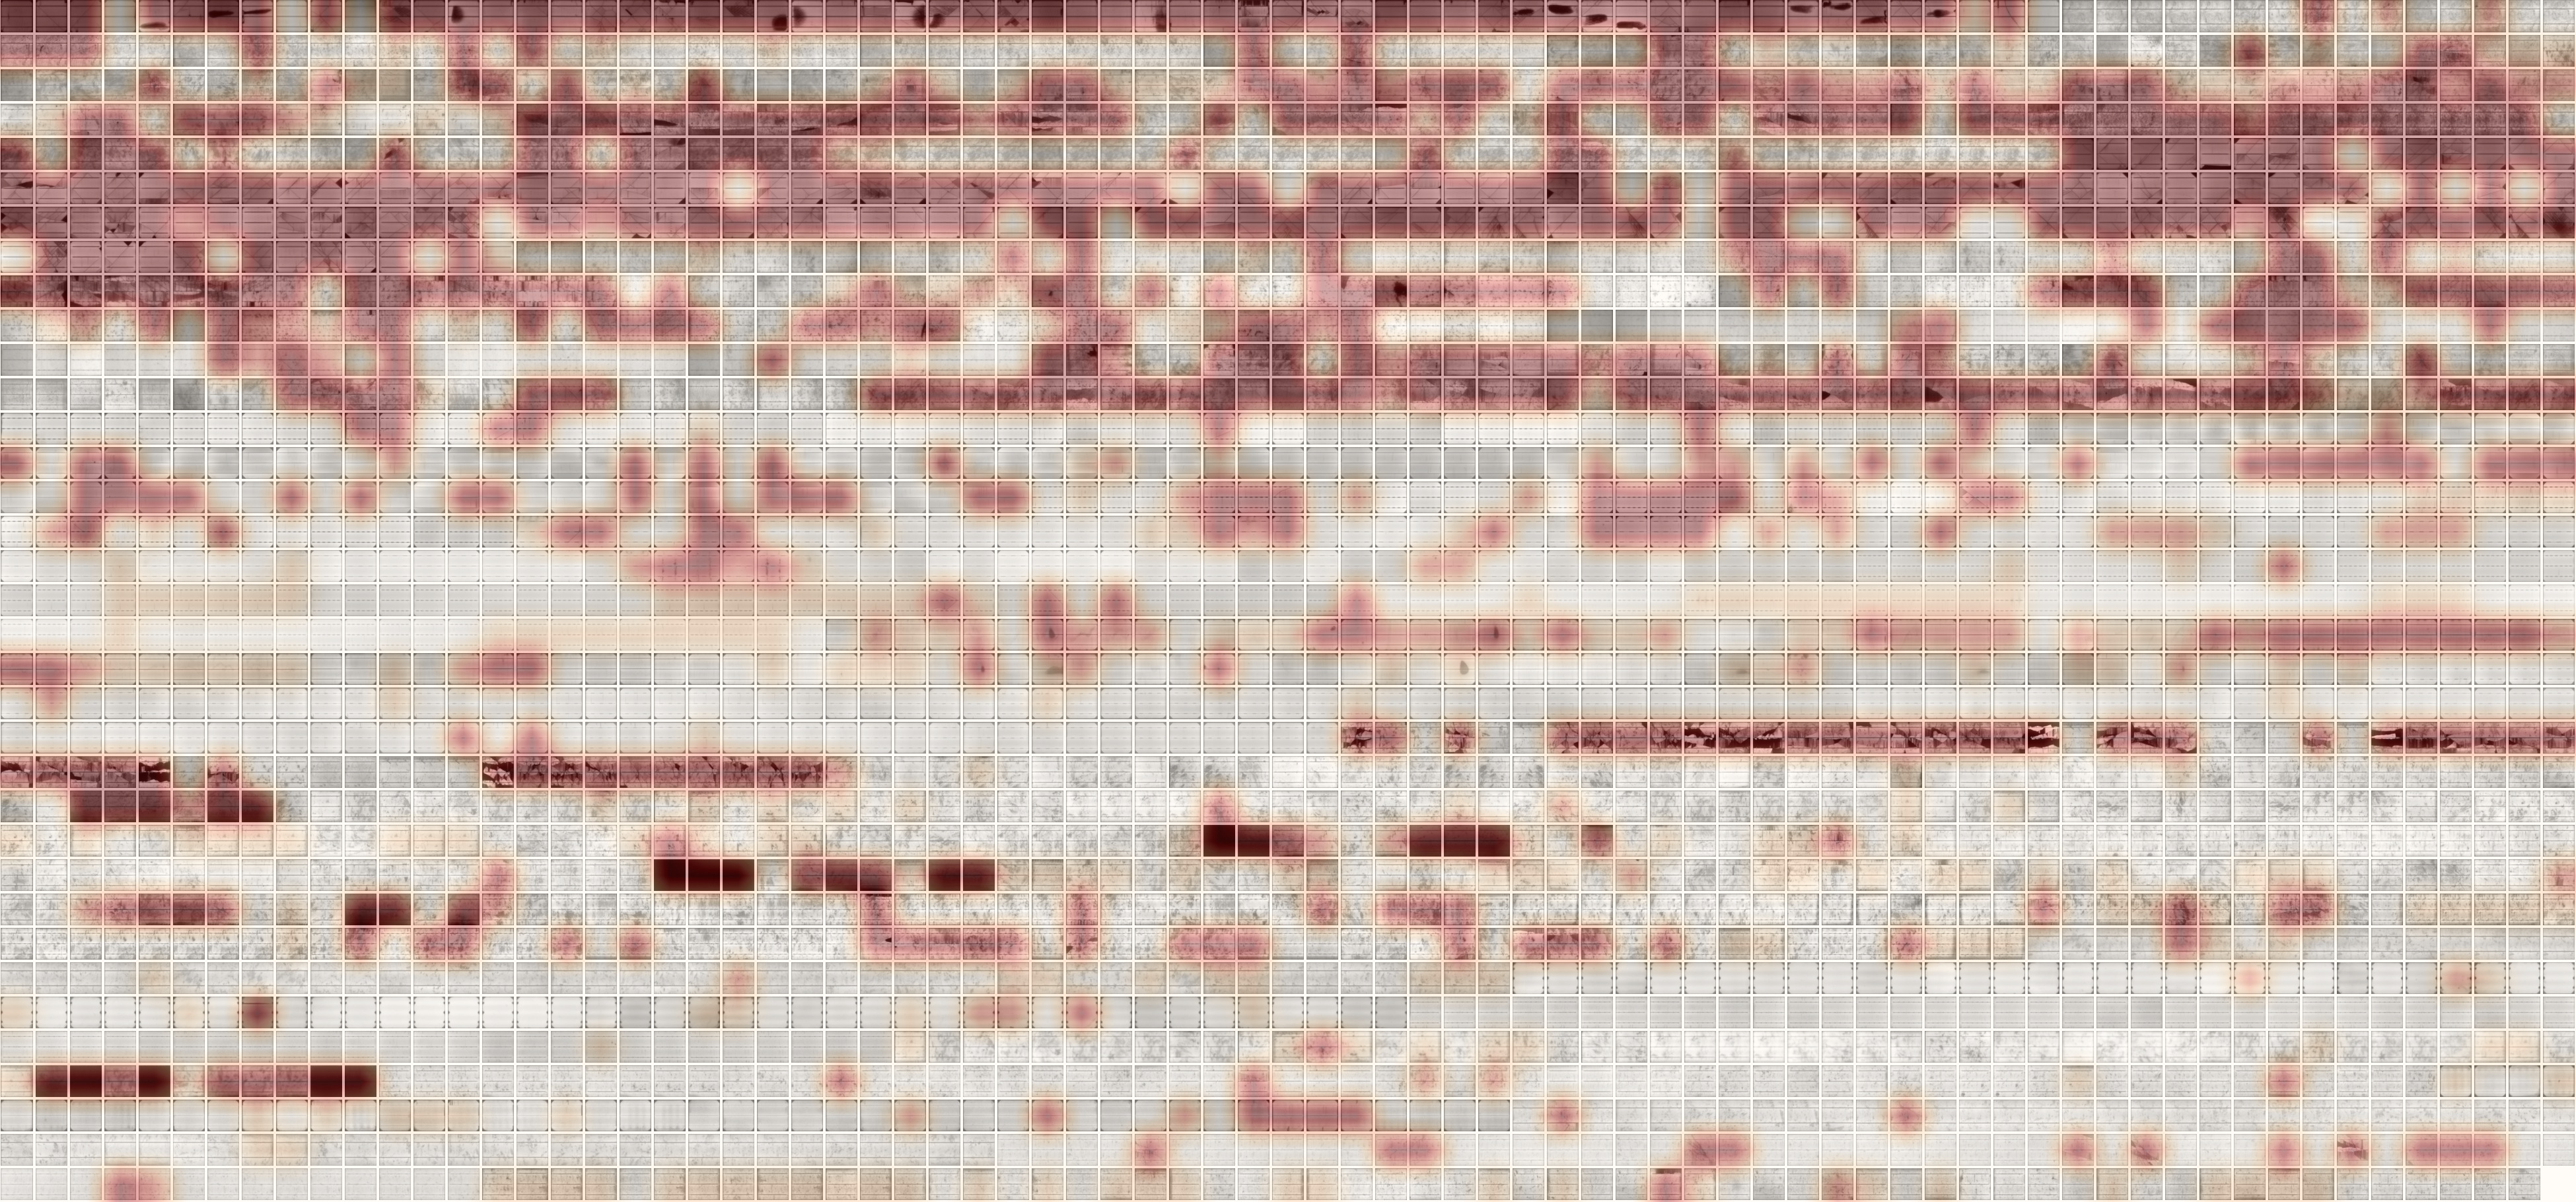
ELPV Probability Counts
| Defect probability | Images |
|---|---|
0.0 |
1508 |
0.3333333333333333 |
295 |
0.6666666666666666 |
106 |
1.0 |
715 |
ELPV Module-Type Counts
| Module type | Images |
|---|---|
mono |
1074 |
poly |
1550 |
From PV-Multi-Defect
PV-Multi-Defect uses object boxes on panel images. It is useful for checking whether a detector can localize visible surface defects, not only classify a full image as defective.
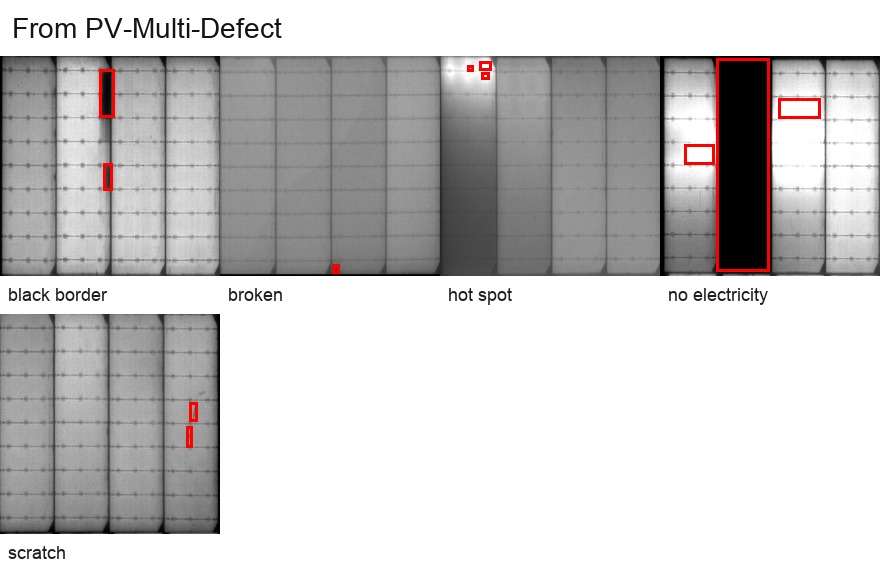
Source Example Images From PV-Multi-Defect





PV-Multi-Defect Box Counts By Class
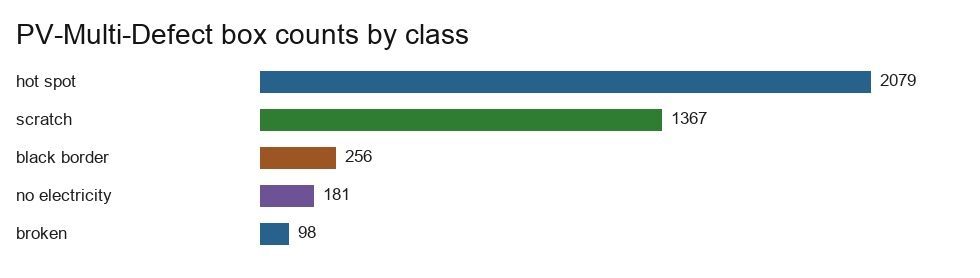
| Class | Boxes |
|---|---|
black_border |
256 |
broken |
98 |
hot_spot |
2079 |
no_electricity |
181 |
scratch |
1367 |
From PVEL-AD
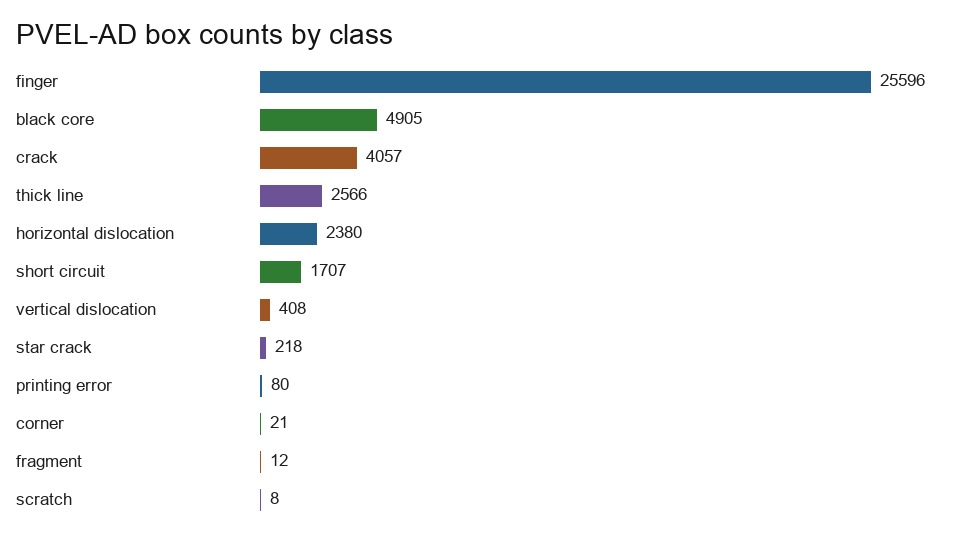
PVEL-AD is the main long-tail object detection dataset in this workspace. The detector input is a near-infrared EL image. The output is a set of bounding boxes with one of 12 defect classes.
PVEL-AD Box Counts By Class
| Class | Boxes |
|---|---|
black_core |
4905 |
corner |
21 |
crack |
4057 |
finger |
25596 |
fragment |
12 |
horizontal_dislocation |
2380 |
printing_error |
80 |
scratch |
8 |
short_circuit |
1707 |
star_crack |
218 |
thick_line |
2566 |
vertical_dislocation |
408 |
PVEL-AD Split Counts
| Split | Images | Annotated images | Boxes |
|---|---|---|---|
| trainval | 4500 | 4500 | 7842 |
| test | 19150 | 19150 | 34116 |
PVEL-AD also contains anomaly-free or auxiliary images without VOC boxes. The full local image count is 36543; the table above counts the images that have released VOC annotations.
How To Read The Result
The counts are normal when the ELPV image total is close to 2,624, PVEL-AD image total is 36,543, and the object-detection datasets show strong class imbalance. That imbalance is not a data error; it is the reason the training plan needs class-aware sampling, careful recall tracking for rare classes, and separate latency checks after model export.